Note
Click here to download the full example code
Flexible sites in a protein structure
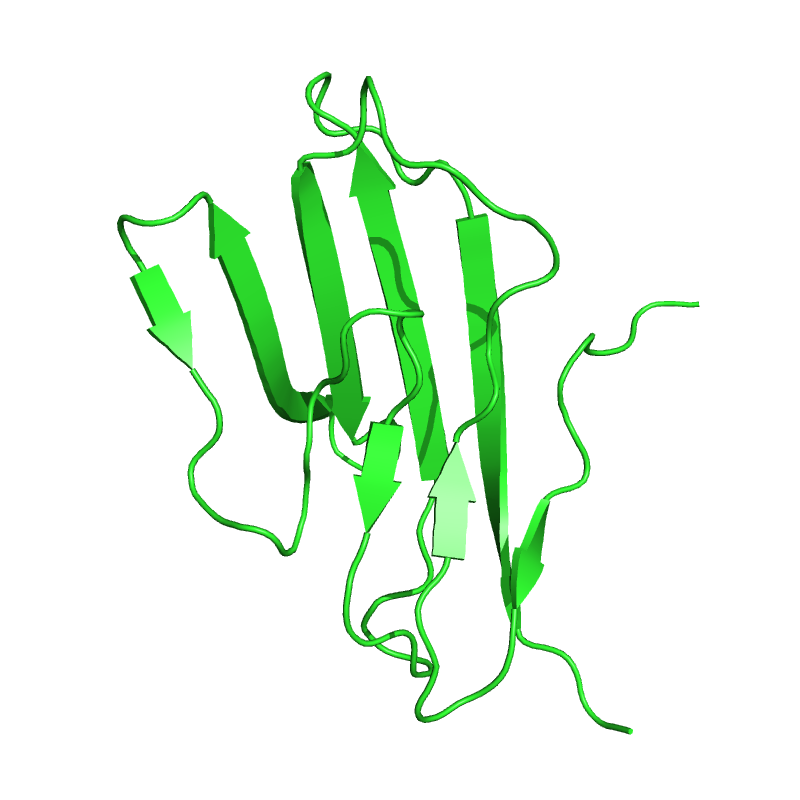
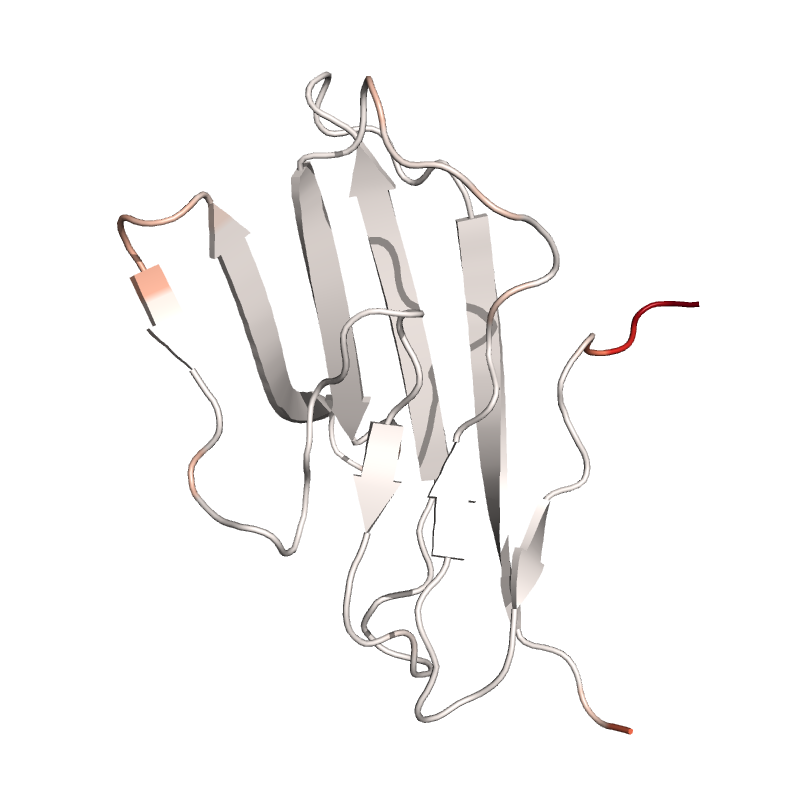
In this example the flexbility of CA atoms in protein structure is displayed: The more flexible a residue is, the redder is its displayed color. The flexibility measure is based on the root mean square fluctuation (RMSF). Although a NMR structure is used here to calculate the RMSF from its multiple states, this script could also be applied to the frames of a molecular dynamics trajectory.
# Code source: Patrick Kunzmann
# License: CC0

import numpy as np
import matplotlib.pyplot as plt
import biotite
import biotite.structure as struc
import biotite.structure.io.mmtf as mmtf
import biotite.database.rcsb as rcsb
import ammolite


PNG_SIZE = (800, 800)
# General configuration
ammolite.cmd.bg_color("white")
ammolite.cmd.set("cartoon_side_chain_helper", 1)
ammolite.cmd.set("cartoon_oval_length", 0.8)
ammolite.cmd.set("depth_cue", 0)
ammolite.cmd.set("valence", 0)
# Fetch and load human CD2 NMR structure and remove glycan
mmtf_file = mmtf.MMTFFile.read(rcsb.fetch("1gya", "mmtf"))
cd2 = mmtf.get_structure(mmtf_file, include_bonds=True)
cd2 = cd2[..., struc.filter_amino_acids(cd2)]

# Push first model to PyMOL
pymol_cd2 = ammolite.PyMOLObject.from_structure(cd2[0])
ammolite.show(PNG_SIZE)

# Use RMSF between NMR models as measure of flexibility
rmsf = struc.rmsf(struc.average(cd2), cd2)
# Use logarithmic scale
log_rmsf = np.log(rmsf)
# Set maximum value for a CA to 1.0
flexibility = log_rmsf / np.max(log_rmsf[cd2.atom_name == "CA"])

# Use a Matplotlib color map for flexibility coloring
# Use discrete color 'steps'
N_COLORS = 20
cmap = plt.get_cmap("Reds")
for threshold_flex in np.linspace(1.0, 0.0, N_COLORS):
    # Discard alpha channel
    color = cmap(threshold_flex)[:3]
    pymol_cd2.color(color, flexibility <= threshold_flex)
ammolite.show(PNG_SIZE)
# sphinx_gallery_thumbnail_number = 2

